
Is a Bitcoin Dump Ahead? Here’s What the Upcoming US Midterm Elections Could Mean for the BTC Price

Bitcoin price is losing momentum heading into the final quarter of 2026, pulling back from the recent high near $87,400. The decline comes after a strong September recovery, with BTC now facing resistance near its recent highs as traders assess whether the latest weakness is simply a short-term correction or the start of a deeper pullback.
On the other hand, the 2026 US midterm elections are scheduled for November, and Bitcoin recorded negative Q4 returns in 2014, 2018, and 2022, raising the question of whether the same pattern could emerge again. With the BTC price currently showing mixed signals between strong institutional demand and fading price momentum, the weeks ahead could determine whether the midterm period becomes another source of volatility for Bitcoin.
Bitcoin has Historically Strengthened After Midterm Elections
The chart shared by analyst Ali below compares Bitcoin’s price action around US election cycles and the period that follows. The historical pattern points to Bitcoin entering stronger upward phases after previous election-related periods, with the gains becoming more pronounced as the broader crypto cycle develops.
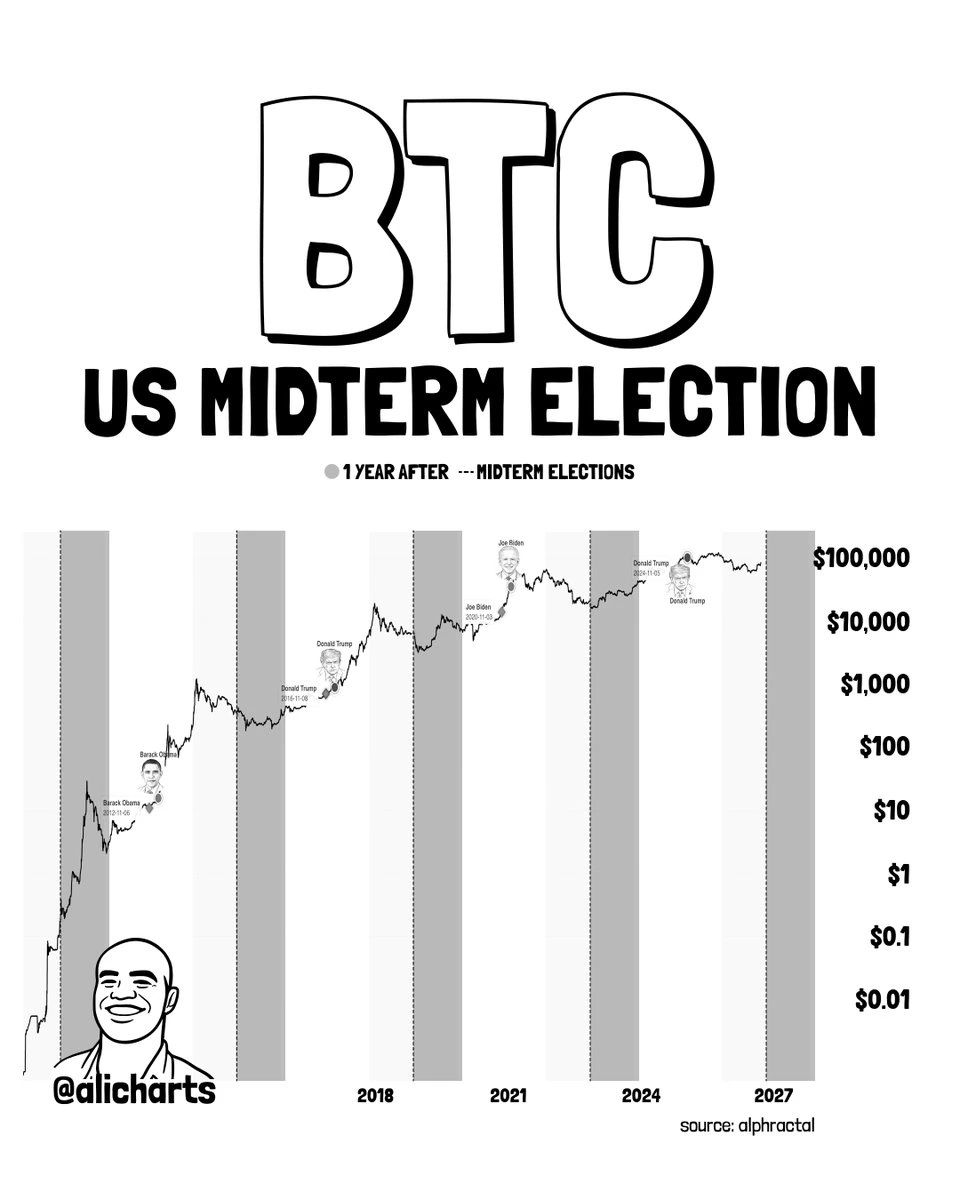
This creates an important contrast with the current late-2026 setup. While Bitcoin has historically experienced periods of weakness and volatility around election cycles, the longer-term price action shown in the chart suggests that these periods have not necessarily marked the end of a Bitcoin bull cycle. For the current market, the key question is whether a potential pre-election correction would simply become another consolidation phase before the next major move higher.


Bitcoin Has Posted Negative Q4 Returns in Every Previous Midterm Year
Bitcoin’s historical Q4 performance adds another layer to the midterm-elections thesis. The Coinglass chart shows that the star token ended the fourth quarter lower in each of the three previous US midterm years.
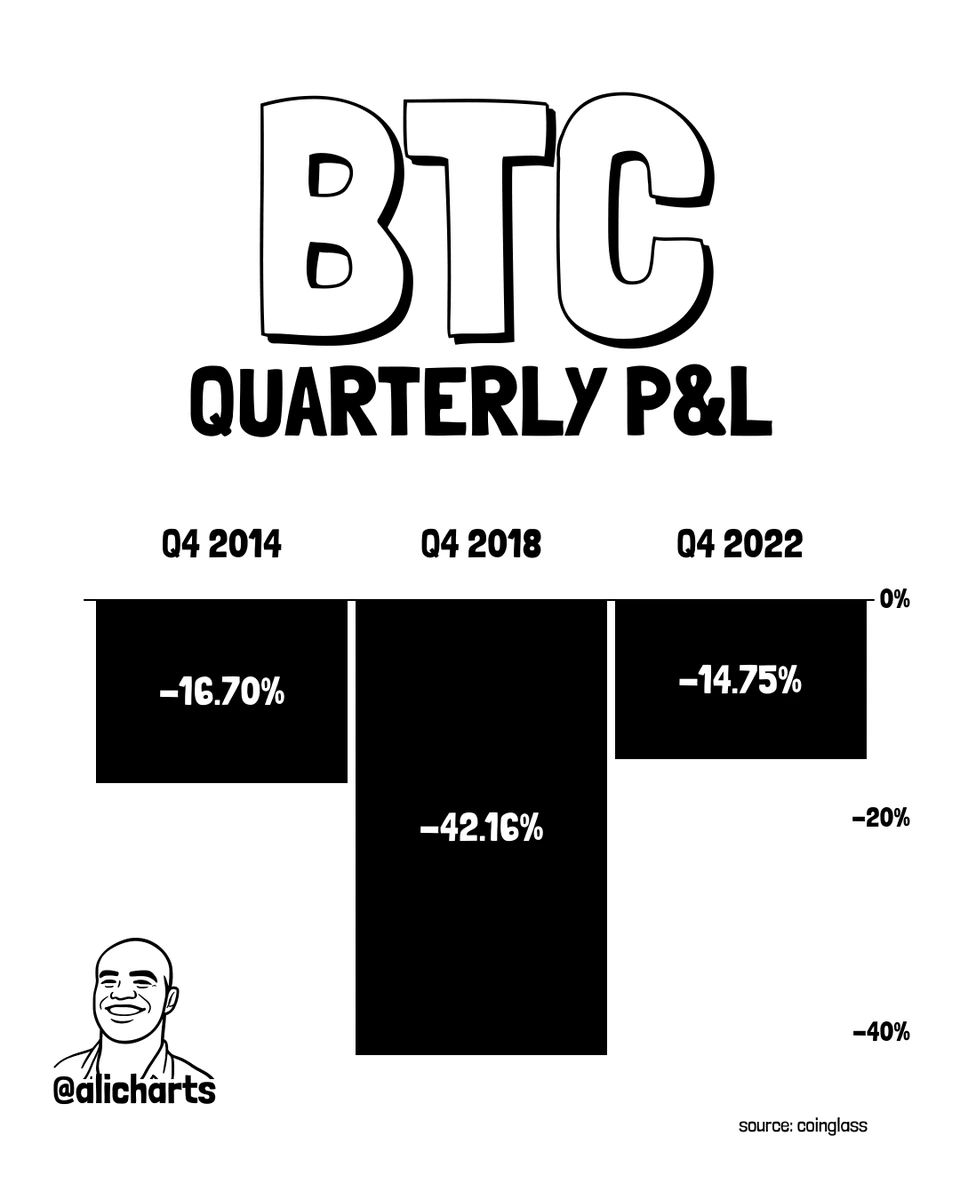
The declines were significant but varied widely. Bitcoin fell 16.70% in Q4 2014, dropped 42.16% in Q4 2018, and declined 14.75% in Q4 2022. With BTC entering its final quarter, the historical record gives traders another reason to watch the price closely. If BTC begins to lose key support levels while broader market conditions deteriorate, the previous midterm-year pattern could become increasingly relevant.
Bitcoin Remains Above Key Short-Term Holder Cost Basis
Bitcoin is currently trading above the short-term holder cost basis, with the chart showing BTC at around $84,276, compared with a short-term holder cost basis near $73,000. The Glassnode-based chart shows how this cost basis has tracked Bitcoin’s broader price cycle, acting as an important reference during both rallies and corrections.
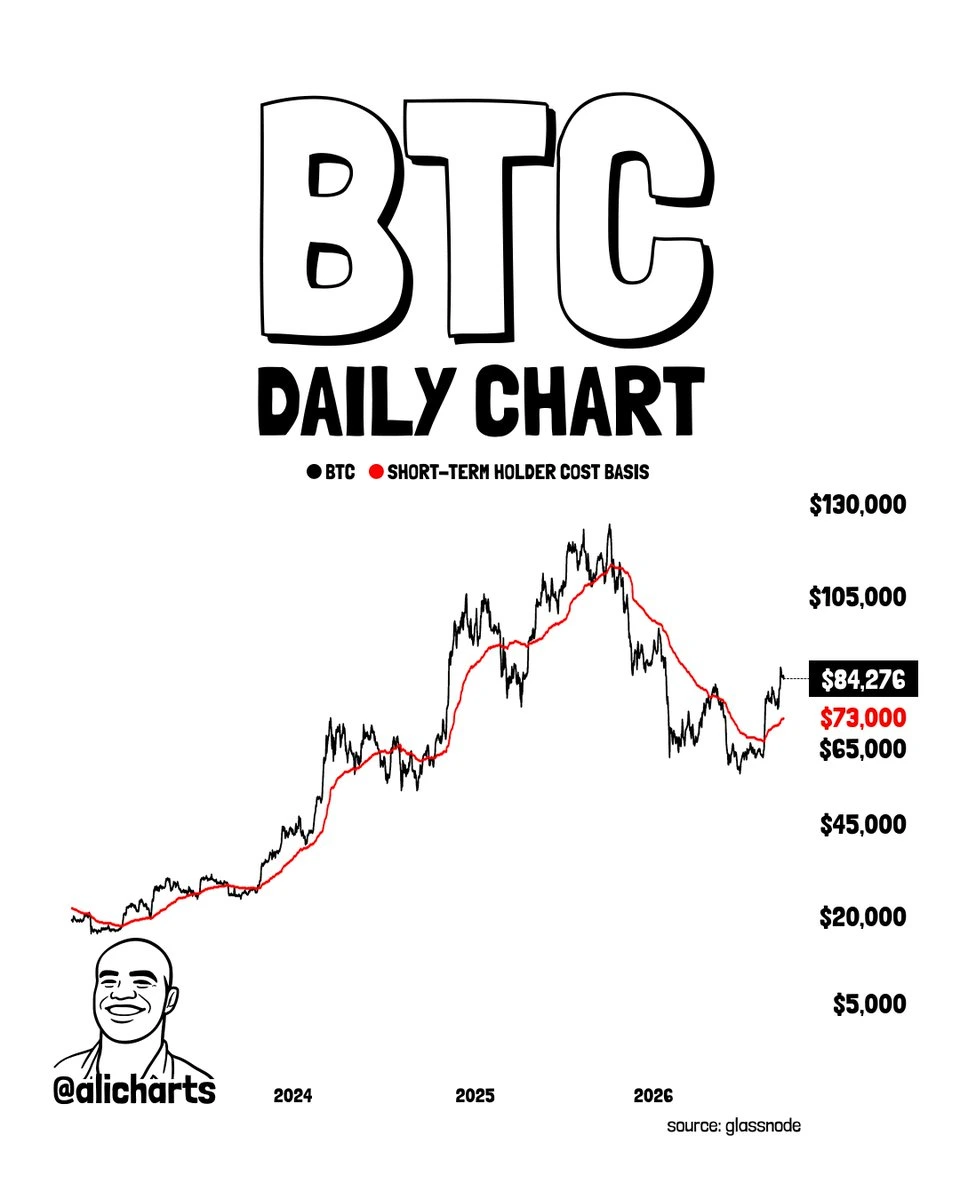
The current gap gives Bitcoin some room before the market reaches the level where recent buyers could come under greater pressure. If BTC extends its pullback, the $73,000 area could become an important test for the current market structure. Holding above it would keep the broder recovery intact, while a sustained move below could signal that selling pressure is becoming more significant as the US midterm elections approach.
What’s Next for the Bitcoin (BTC) Price Rally?
Bitcoin enters the final quarter of 2026 with a mixed setup. BTC remains above its $73,000 short-term holder cost basis, while recent price action shows signs of cooling after the recovery toward $87,400. At the same time, Bitcoin’s historical performance during previous US midterm years provides a reason for caution, with Q4 losses recorded in 2014, 2018, and 2022.
The pattern does not mean the elections will trigger a BTC price plunge; however, it becomes more relevant if BTC starts losing key support while liquidity and institutional demand weaken. For now, the reaction around the $84,000 to $85,000 region, followed by the $73,000 cost-basis level, could offer a clearer indication of whether BTC price is simply experiencing another correction or entering a more sustained period of weakness.
Was this writing helpful?
Story Ends Here
Trust with CoinPedia:
CoinPedia has been delivering accurate and timely cryptocurrency and blockchain updates since 2017. All content is created by our expert panel of analysts and journalists, following strict Editorial Guidelines based on E-E-A-T (Experience, Expertise, Authoritativeness, Trustworthiness). Every article is fact-checked against reputable sources to ensure accuracy, transparency, and reliability. Our review policy guarantees unbiased evaluations when recommending exchanges, platforms, or tools. We strive to provide timely updates about everything crypto & blockchain, right from startups to industry majors.
Investment Disclaimer:
All opinions and insights shared represent the author’s own views on current market conditions. Please do your own research before making investment decisions. Neither the writer nor the publication assumes responsibility for your financial choices.
Sponsored and Advertisements:
Sponsored content and affiliate links may appear on our site. Advertisements are marked clearly, and our editorial content remains entirely independent from our ad partners.
Read the Next News